Graph/Chart View – Bar Graph
Use the chart/Graph view to drag and drop columns to a design chart.
Oracle BI Answers supports a variety of standard chart types, including bar charts, column charts, line charts, area charts, pie charts, and scatter charts. Custom chart subtypes include two-and-three-dimensional, absolute, clustered, stacked, combination, and custom.
Graph view which is used to display the analysis in a graphical view.
Graph view classified into 10 type of charts.
1. Bar chart:
After create the analysis just add the new view graph you will get the list and types of graph like shown below.


Types of Bar Chart:
1. Vertical (Default)
2. Horizontal
3. Stackedvertical
4. Stacked Horizontal
Steps to deploy vertical graph:
1. NewàGraphàBarà Vertical (Default)
2. Click edit the graph


Graph Prompts:
Which is used to see the list of values under the column instead of going as row by row
We can see through the drop down .


Sections:
Which is used to see the values in a paragragh manner
In 11 g we got the option directly , “Display as slider”
The slider menu which Is use to see the values in a running mode, automatically.
Moving one column to Sections , the data for that column will seperated as sections and it shows data in paragraph

We will have the output as:

Year will be formatted as section wise , 2011 one section and 2012 one section wise the analysis has deployed.
Slider:
Slider is the new option directly implemented with the sections, which is used for graphical appearance and can see the difference of values while comparing from year – year by runing format.

Check in the “ Display as Slider”

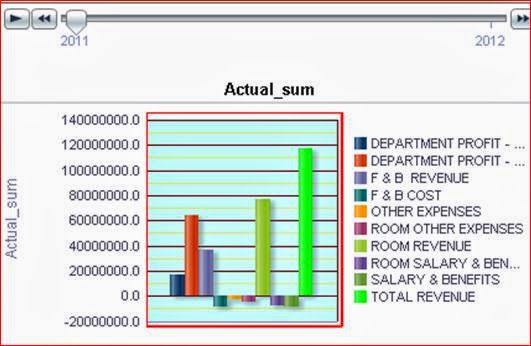
After making year as a slider in sections, a play and forward and reverse button appeared in the graph by showin the year with the actual_sum(values).
If we want to check the amount for the particular year, we can play the option to see the changes and the values.
Bar graph:
1. In bar graph layout measures and Bars are the 2 sections.
2. In measure pane, a measure logical column need to add.
3. It shows the values in bar format as in vertical position.
4. In bars pane, group by (horizontal axis), which is used to show the list of description or list of column values in the horizontal manner.

5. Vary color by (horizontal axis) which is used to show the list of description or list of column values by horizontal manner with differents in color variation, It defines variation by showing different color for the values of columns.

6. Vary color by (horizontal axis) under that one check box with the option of show in legend will be there, if we check in the “show inlegend” the list of column values will get display in the right side of the graph and it defines the colors of the bars also.
Subject area:
1. In the graph layout right hand down side we have the option named as “show subject area folders” with the check box.
2. Which is used to see the columns belongs to which table.

3. Check in the “show subject area folders” in the right side of pane marked.
4. Can see the related table of the column after check in.

Final View of the graph after edited.

I have a requirement :
ReplyDeleteI need to display time of a day (say, 12:24:34) vs. dates id bar/line graph. Which is say, to display the logging off times of each day Vs. say last 7days. Trying to give one graphical view below:
Date
|
|_ _ _ Time
01-May-2014 |===============07:14 PM
02-May-2014 |======================09:20 PM
03-May-2014 |===================08:10 PM
04-May-2014 |=================07:30PM
Any help is highly appreciated. Thanks!
-Subrata Sarkar, Kolkata