KPI (Key Performance Indicator), Performance of an organization by using measures.
Strategic updates and information about an organization performance.
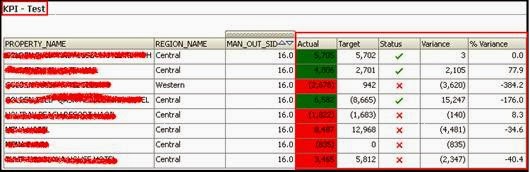
KPI is based on comparing Actual and target performance.
Steps To Develop a KPI:
Step 1:
Click on new à click KPI under Performance management.

Step 2:
There are 5 steps to complete the KPI performance management to define Actual and target comparisons.
1. General Properties
2. Dimensionality
3. States
4. Related Documents
5. Custom Attributes

Step 3:
General Properties:
In this section we are going to Set the actual values and target values from the subject area which we designed in RPD (Admin Tool).
Business Owner you can set based on the requirement and administrator privileges.

Set the actual value and target value from the tables from subject area using the key button.
Here itself you can define the function or calculation using the key FX.


Data format is to set the format of the data at output, the number format, decimal format, percentage format are the different mode of showing data.

Check in Enable Trending, Which is used to compare the actual and target value based on the period or some other dimension and as well as measures.
Tolerance can be depends on percentage or as actual value.

Step: 4
Dimensionality:
Dimension tables can add to get the actual and target value by prompted or for a particular dimension we can get the output.

Here I have used 3 dimensions for the actual and budget variation. 2 dimensions are prompted and one dimension is meant for one particular value. So according to this the values are get filtered and shows in output.
To Add Dimension table Use the Tab with the name of “Add…”
You will get the subject areas under that all the tables and columns will get display.

Step 5:
States:
KPI States which is used to compare the values between actual and target, it will shows the status of the report.
KPI - state, define a label, color, and icon. Determine state ranges by defining threshold values between each state.
State Properties has three types
1. Goal – High Values are Desirable
2. Goal – Low values are Desirable
3. Goal – Target Value is Desirable
High Values are Desirable
– which includes the compared value which is higher and Greater than100% of the target value then the status will say ok and with the user – defined color.
If the value is between 90% and 100% of the target value then the status will display as warning with the user – defined color.
If the values are between less than 90% of the target value then the status will display as critical with the user defined color.

Status label is a user – defined, you can alter the status label according to client requirement.

Color is a user – defined, you can define the color according to client requirement by clicking down arrow on the color box.

Icon is a user – defined, you can define the icons for the status according to client requirement.

Actions:
It is used to link to some other report or Dashboards or other kpi’s or to some WebPages by clicking on the value.

Low Values are desirable
If the value is more than 100% of the target value then the status will display as Critical with the user – defined color.
If the value is between 90% and 100% of the target value then the status will display as warning with the user – defined color.
If the value is less than 90% of the target value then the status will display as critical with the user – defined color.

Target Value is Desirable
In this goal it will compare the target value and shows the status according to it.
For the entire goal you can change the color, status label, icons, Actions and threshold values and its percentage.
In case if the KPI returns with no data then it can show No Status or critical or ok or Warning depends on the users.

We have one more option in the states “Show Advanced Properties” which is used to link the score in this KPI.
Score will have User value, Use percentage of target, use percentage of variance, and use a custom expression.
Here you can show the target value based upon the percentage of target value and variance value or by manual value filled by user.
We can add more Status like ok, warning, critical and more with threshold values and conditions.


Step 6:
Related Documents:
You can add some of the related Documents by using this KPI.
Adding a document is two type of mode one type is Catalog and another one is by Link.

Step 7:
Custom Attributes:
Manually you can create columns and you can add some of the calculations by using formulas.

Click finish to save the KPI and Check in the report.

Comments
Post a Comment