
Map viewer in OBIEE 11g - Part -2


Map View in OBIEE 11g – Part 2

Building Map View in Presentation Side (Answer)
1.      Login to presentation (Answer side) to check the map view is working or not.(http://localhost:9704/analytics)
2.      Already we have changed the privileges for map data.
3.      Click on Administration Γ  go to Map Data Management Γ  Click on Manage Map Data.


4.      Initially there won’t be layers, background Maps and Images.

5.      Click here to add a new layer, to add layers from mv demo data.
A new dialogue box will get open to import layers from the created data sources.

6.      Once you add layers then we need to subject areas for the layers.
Need to add BI key column s from the subject areas.


Click ok.
7.      Go to the next tab “Background Maps” and add background maps.


Check in the list whether the created bing map1 and its subject area are created.

8.      To add images go to 3rd tab, you can assign images from mvdemo.


Click under the name, you will get a new dialogue box with lot of images under created data source.
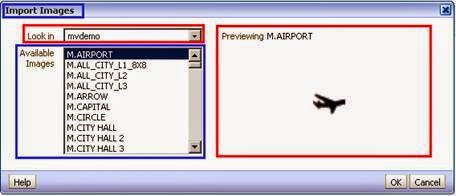
Click ok.

9.      Create new analysis with that subject area and add map view.
Add some column from the subject areas which have given in Managed Map data.

Click results to view the compound layout, in that add Map view to get the map.


Comments

Popular posts from this blog

Contact Me

Do You have any queries ?                   If you are having any query or wishing to get any type of help related Datawarehouse, OBIEE, OBIA, OAC then please e-email on below. I will reply to your email within 24 hrs. If I didn’t reply to you within 24 Hrs., Please be patience, I must be busy in some work. kashif7222@gmail.com

Top 130 SQL Interview Questions And Answers

1. Display the dept information from department table.   Select   *   from   dept; 2. Display the details of all employees   Select * from emp; 3. Display the name and job for all employees    Select ename ,job from emp; 4. Display name and salary for all employees.   Select ename   , sal   from emp;   5. Display employee number and total salary   for each employee. Select empno, sal+comm from emp; 6. Display employee name and annual salary for all employees.   Select empno,empname,12*sal+nvl(comm,0) annualsal from emp; 7. Display the names of all employees who are working in department number 10   Select ename from emp where deptno=10; 8. Display the names of all employees working as   clerks and drawing a salary more than 3000   Select ename from emp where job=’clerk’and sal>3000; 9. Display employee number and names for employees who earn commission   Select empno,ename from emp where comm is not null and comm>0. 10

Informatica sample project

Informatica sample project - 1 CareFirst – Blue Cross Blue Shield, Maryland (April 2009 – Current) Senior ETL Developer/Lead Model Office DWH Implementation (April 2009 – Current) CareFirst Blue Cross Blue Shield is one of the leading health care insurance provided in Atlantic region of United States covering Maryland, Delaware and Washington DC. Model Office project was built to create data warehouse for multiple subject areas including Members, Claims, and Revenue etc. The project was to provide data into EDM and to third party vendor (Verisk) to develop cubes based on data provided into EDM. I was responsible for analyzing source systems data, designing and developing ETL mappings. I was also responsible for coordinating testing with analysts and users. Responsibilities: ·          Interacted with Data Modelers and Business Analysts to understand the requirements and the impact of the ETL on the business. ·          Understood the requirement and develope