Spatial tables are the tables with a column of the type SDO_GEOMETRY().
Let us create a spatial table that holds data for customer as
CREATE TABLE CUSTOMERS (
CUST_ID NUMBER PRIMARY KEY,
NAME VARCHAR2(32),
CUST_ADDR SDO_GEOMETRY);
Cust_addr hold the geometrical address [coordinates] of the customer.
Insert values into the table using the formats
INSERT INTO CUSTOMERS VALUES( 1,
'RAM',MDSYS.SDO_GEOMETRY(2001,8307,
MDSYS.SDO_POINT_TYPE(-64.93257,18.34048,NULL),NULL,NULL)
);
Here we are using the MDSYS.SDO_POINT_TYPE as it is a point location. If we need to insert an array of values [E.g. border coordinates for a country], then we have to use the following
INSERT INTO COUNTRY VALUES( 1,
'RSA',MDSYS.SDO_GEOMETRY(2003,8307,NULL,MDSYS.SDO_ELEM_INFO_ARRAY(1,1003,1),MDSYS.SDO_ORDINATE_ARRAY(-114.05005,37,-113.62431,37.00005,-113.62244,37.00005,-111.61583,37.00137,-111.49798,37.0015,37.5965,-114.05005,37))
SDO_ORDINATE_ARRAY tells us that it’s an array of values and need to be grouped together.
Note:
The first and last values should be the same in case of ordinate array to form a closed loop.
MDSYS.SDO_GEOMETRY(2001,8307,
MDSYS.SDO_POINT_TYPE(-64.93257,18.34048,NULL),NULL,NULL)
2001 is for point type, 2003 is for a polygon
8307 is the srid for the coordinate system
The order of the coordinates is longitude,latitude
Insert the required values into the spatial table accordingly
Updating the mdsys metadata tables and creating an spatial index
1. Though a new spatial table has been created, it will not show up in map viewer till the reference has been made into the metadata table
2. Insert the table details that you have created into user_sdo_geom_metadata view.
INSERT INTO USER_SDO_GEOM_METADATA(TABLE_NAME,COLUMN_NAME,DIMINFO,SRID)
VALUES ('CUSTOMERS','CUST_ADDR',
SDO_DIM_ARRAY( -- 20X20 GRID
SDO_DIM_ELEMENT('X', 0, 20, 0.005),
SDO_DIM_ELEMENT('X', 0, 20, 0.005)),8307);-- SRID
Here, column name is the name of the column with the type sdo_geometry. Grid size can be decided based on the locations. For province and country, one can use a greater grid size
3. Commit the changes. Note that spatial indexes cannot be built if the metadata view has not been updated.
4. We can create a spatial index on the geometry column by running the command
CREATE INDEX CUST_IDX ON CUSTOMERS(CUST_ADDR)
INDEXTYPE IS MDSYS.SPATIAL_INDEX;
5. Now the metadata tables are ready and can be configured using map viewer.
Configuring map builder
1. Download the mapbuilder jar file from this location or the Oracle site based on your version.
2. Extract the zip and launch the map builder by double clicking on the file. This will only work if the java_home and path variables are set. Alternatively, one can launch the same by running the command “path of jdk” –jar “path of mabbuilder.jar”
E.g. "C:\Program Files\Java\jdk1.7.0_60\bin\java" -jar “D:\mtn\mapbuilder_12.1.3\mapbuilder.jar”
3. Map builder will launch accordingly
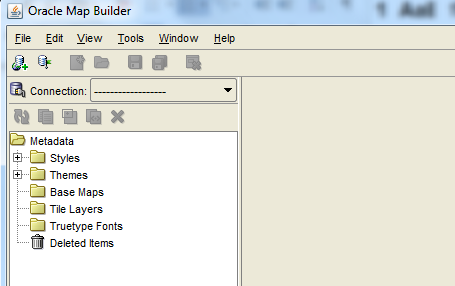
4. Click on Connection drop down and select the Load/Add/Remove option to configure the schema
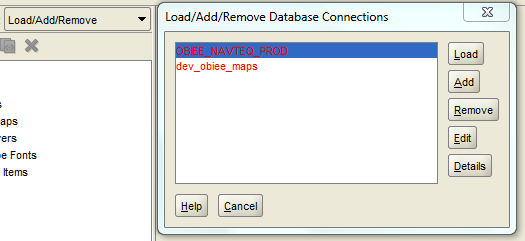
5. To create new schemas, click on Add and enter the required details. These details are for the metadata schema for maps.
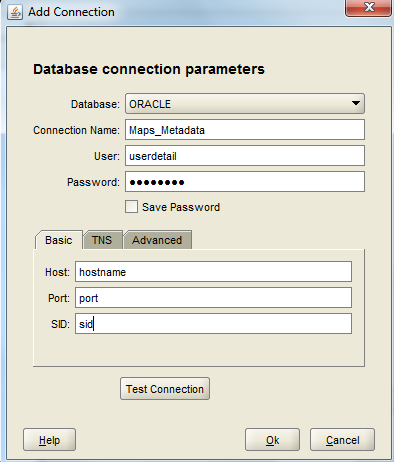
6. The connections will now show up as a list and you can select the required one and click on “Load
to load all the objects
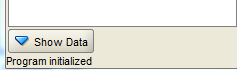
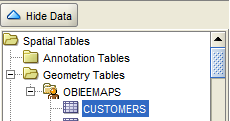
7. At the bottom left corner, we can see the Show Data dropdown. Expand the same.
8. Expand the Geometry tables and we can find the table that we created. Note that this is a base table. A layer hasn’t yet been created for the same.
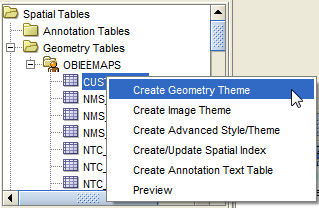
9. Right click on the table and select “Create Geometry Theme”
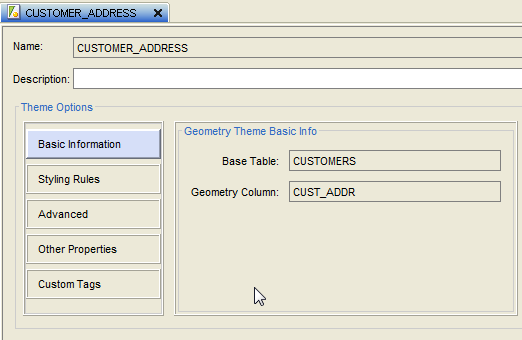
10. Enter a theme name and description if required.
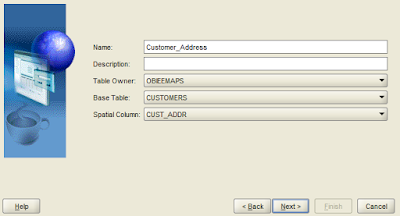
11. Spatial Column should show up with the required one that we created. If it is blank, then the spatial types haven’t been created accordingly. Click on Next.
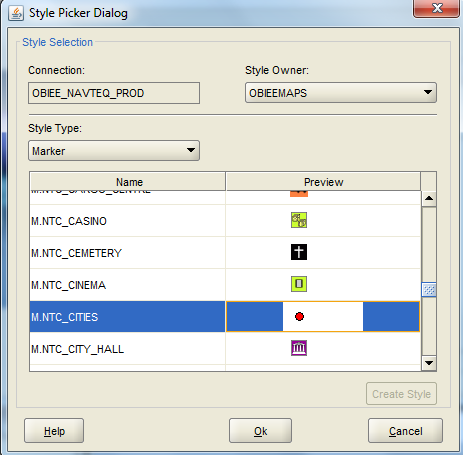
12. Select the required style type. This style will be used to display the data.
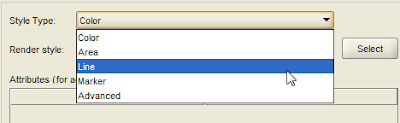
13. Here, I am selecting a marker type which is a red dot. Click OK
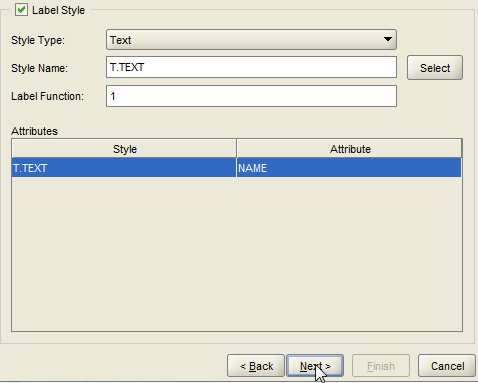
14. Select a label style next. This style will be used to display the label. You can browse the various styles available clicking on select. Also select the column under attribute. Then click on next.
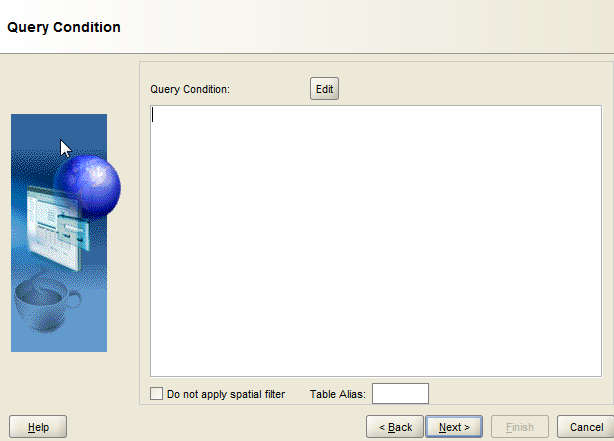
15. We can add a query condition to filter the data if required. Click on next.
16. A summary should show up. Check if everything is as per your selection and click on Finish
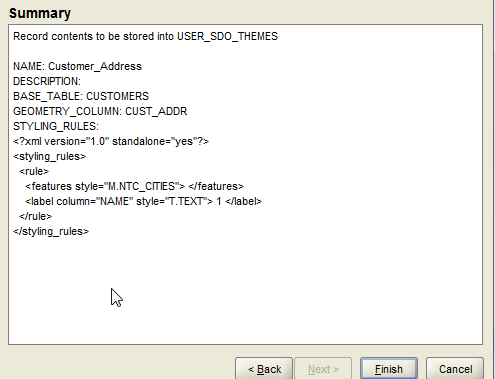
17. A theme Customer_Address should now be created.
18. Click on Advanced and edit the details [available at bottom left]
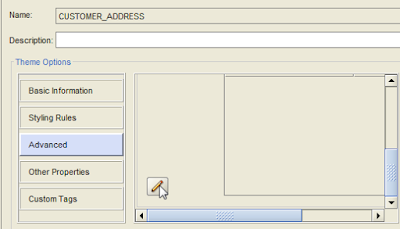
19. Click on Add New Row
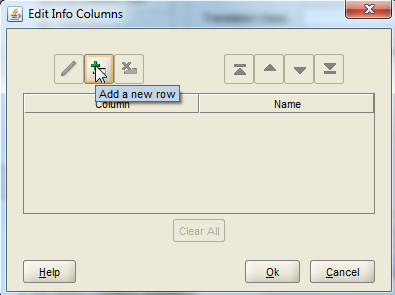
20. Select the column and enter a display name. These will be acting as the keys for the layers and used to join with the analysis tables. Multiple columns can be selected and we can use basic sql functions also. But while associating a subject area to the layer, only one key can be selected
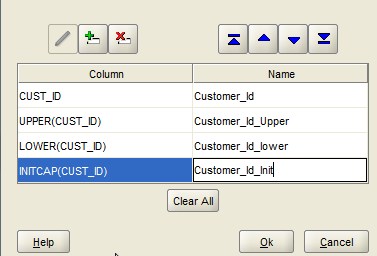
21. Click OK and the columns should now show up as Info Columns. Edit other options also if required.
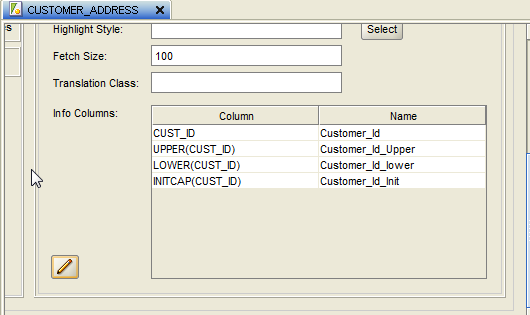
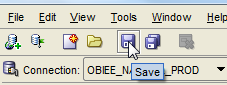
22. Click on save and the layer will be created.
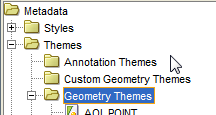
23. We can find the newly created theme under Geometry Themes
24. Right Click on the theme and click on Preview, then the green arrow, to see if the theme is valid.
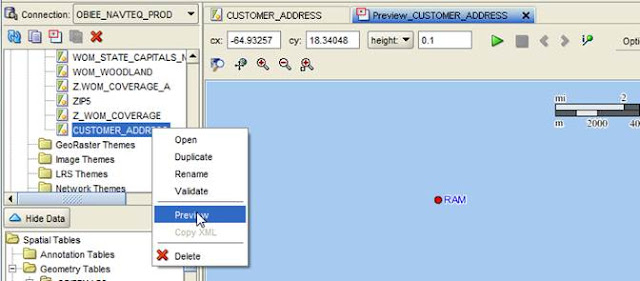
25. Thus a custom layer has now been created.
26. Login to Analytics and Click on Manage Map Data under Administration.
27. Click on import layers to import the newly created “Customer Address”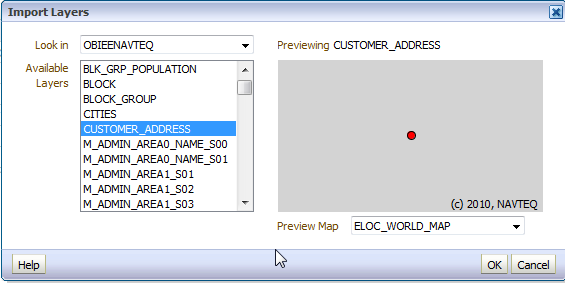
28. Now we can associate this layer to a subject area and proceed with our analysis.
VALUES ('CUSTOMERS','CUST_ADDR',
SDO_DIM_ARRAY( -- 20X20 GRID
SDO_DIM_ELEMENT('X', 0, 20, 0.005),
SDO_DIM_ELEMENT('X', 0, 20, 0.005)),8307);-- SRID
Here, column name is the name of the column with the type sdo_geometry. Grid size can be decided based on the locations. For province and country, one can use a greater grid size
3. Commit the changes. Note that spatial indexes cannot be built if the metadata view has not been updated.
4. We can create a spatial index on the geometry column by running the command
CREATE INDEX CUST_IDX ON CUSTOMERS(CUST_ADDR)
INDEXTYPE IS MDSYS.SPATIAL_INDEX;
5. Now the metadata tables are ready and can be configured using map viewer.
Configuring map builder
1. Download the mapbuilder jar file from this location or the Oracle site based on your version.
2. Extract the zip and launch the map builder by double clicking on the file. This will only work if the java_home and path variables are set. Alternatively, one can launch the same by running the command “path of jdk” –jar “path of mabbuilder.jar”
E.g. "C:\Program Files\Java\jdk1.7.0_60\bin\java" -jar “D:\mtn\mapbuilder_12.1.3\mapbuilder.jar”
3. Map builder will launch accordingly

4. Click on Connection drop down and select the Load/Add/Remove option to configure the schema

5. To create new schemas, click on Add and enter the required details. These details are for the metadata schema for maps.

6. The connections will now show up as a list and you can select the required one and click on “Load
to load all the objects
7. At the bottom left corner, we can see the Show Data dropdown. Expand the same.

8. Expand the Geometry tables and we can find the table that we created. Note that this is a base table. A layer hasn’t yet been created for the same.

9. Right click on the table and select “Create Geometry Theme”

10. Enter a theme name and description if required.

11. Spatial Column should show up with the required one that we created. If it is blank, then the spatial types haven’t been created accordingly. Click on Next.
12. Select the required style type. This style will be used to display the data.

13. Here, I am selecting a marker type which is a red dot. Click OK

14. Select a label style next. This style will be used to display the label. You can browse the various styles available clicking on select. Also select the column under attribute. Then click on next.

15. We can add a query condition to filter the data if required. Click on next.

16. A summary should show up. Check if everything is as per your selection and click on Finish

17. A theme Customer_Address should now be created.

18. Click on Advanced and edit the details [available at bottom left]

19. Click on Add New Row

20. Select the column and enter a display name. These will be acting as the keys for the layers and used to join with the analysis tables. Multiple columns can be selected and we can use basic sql functions also. But while associating a subject area to the layer, only one key can be selected

21. Click OK and the columns should now show up as Info Columns. Edit other options also if required.

22. Click on save and the layer will be created.

23. We can find the newly created theme under Geometry Themes

24. Right Click on the theme and click on Preview, then the green arrow, to see if the theme is valid.

25. Thus a custom layer has now been created.
26. Login to Analytics and Click on Manage Map Data under Administration.
27. Click on import layers to import the newly created “Customer Address”

28. Now we can associate this layer to a subject area and proceed with our analysis.
Comments
Post a Comment